
Compute Analysis
The Next Compute Cycle
Why the next phase of AI will be shaped by power, infrastructure, and the ability to turn compute into useful work.

Executive summary
Artificial intelligence is becoming an infrastructure question. A model can be distributed as software, but running it reliably depends on an unusually physical chain: electricity, cooling, chips, memory, networks, and the people who operate them. Each link imposes its own cost and timetable.
Our thesis is that the next compute cycle will reward coordination across that chain. Owning more accelerators is useful only when they can be powered, kept productive, and matched to work that justifies their cost. A technically impressive installation can still be an economically weak system.
Three distinctions matter. Electricity demand is local, even when the market for AI is global. Cheaper inference does not determine total demand. And installed capacity is different from useful capacity. Together, these distinctions change how an organization should evaluate infrastructure commitments.
This analysis develops a practical framework for those decisions. It combines the IEA's 2025 outlook and 2026 update with Stanford's historical inference-cost comparison and published work on model serving. The strategic interpretation is Quandelia's.
Updated September 13, 2026 with the IEA's 2026 evidence.
Power changes the geography of compute
In its 2025 outlook, the IEA estimated that data centers used 415 TWh of electricity globally in 2024. Its base case projected roughly 945 TWh in 2030. These totals include all data-center workloads, not AI alone, and the latter is a projection rather than an observed outcome. 1
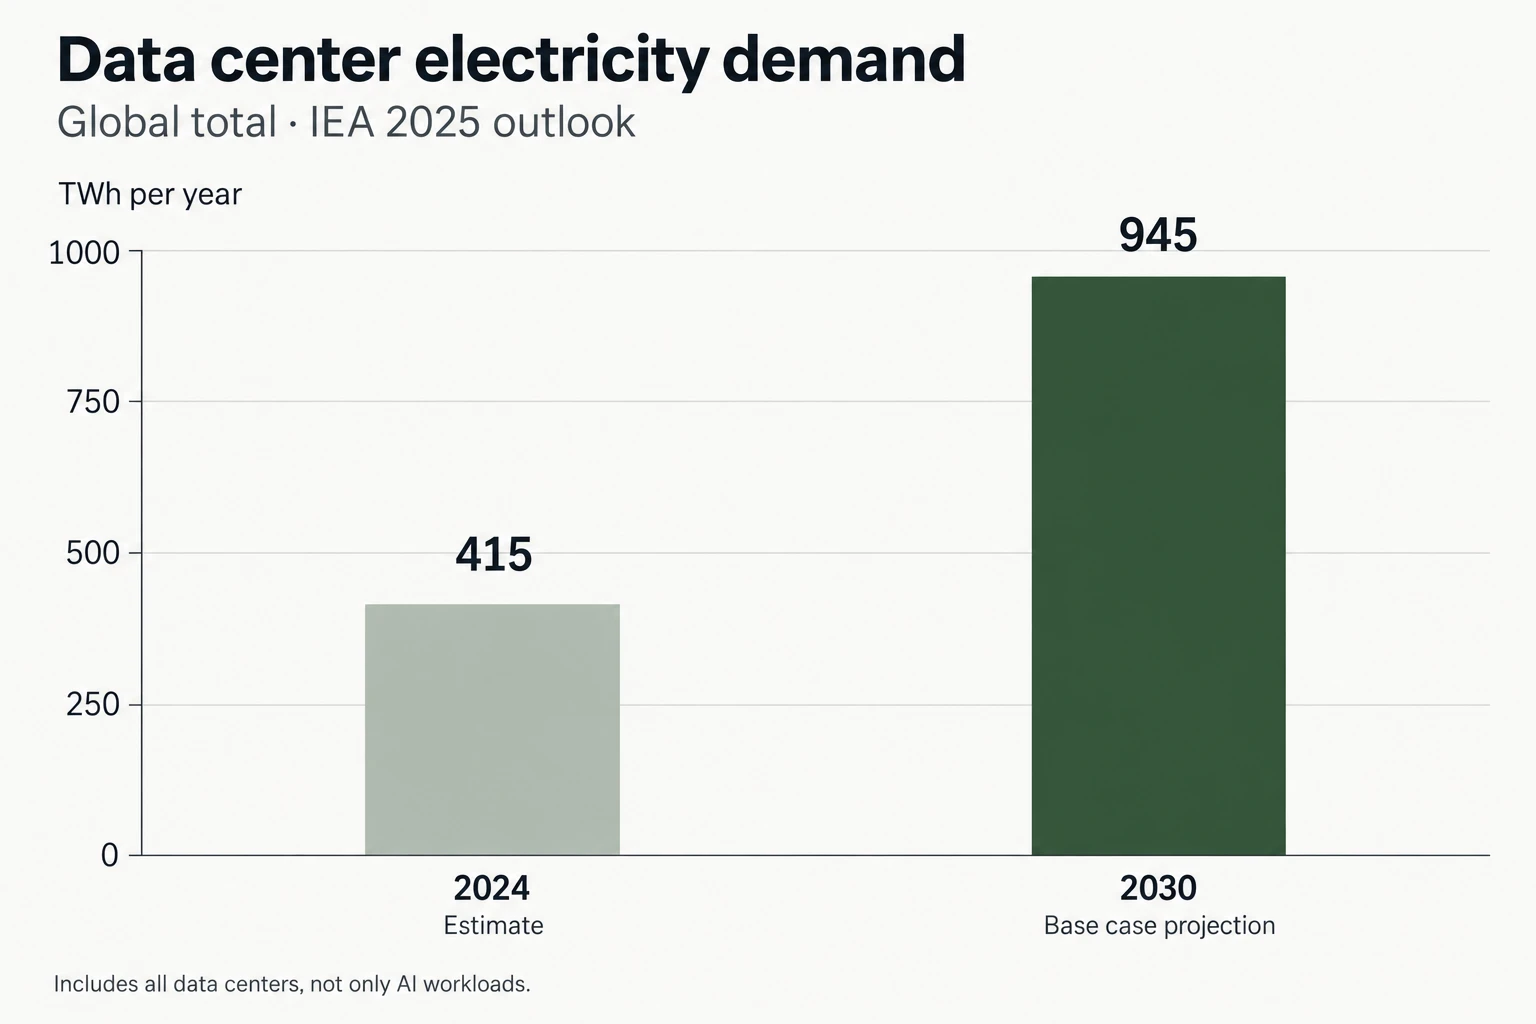
The IEA's 2026 update estimates that global data-center electricity consumption reached roughly 485 TWh in 2025 and projects around 950 TWh in 2030. This is a newer forecast vintage, not a change to the historical chart above. Its discussion of constrained equipment supply and grid connections reinforces the need to distinguish planned capacity from capacity that can actually operate. 4
The important unit for a siting decision is more specific than global terawatt-hours. It is the power that can be delivered at a particular connection, on a particular date, under acceptable operating conditions. A country may have ample generation while an attractive location remains difficult to connect.
The IEA also identified grid constraints as a potential source of project delays. It noted that new transmission lines in advanced economies can take four to eight years to build. 1 That mismatch creates a sequencing problem: hardware procurement and physical infrastructure do not necessarily move on the same clock.
For a project team, this suggests moving the power question to the beginning of evaluation. The useful questions concern the connection's maturity, the party responsible for upstream upgrades, operating restrictions, and what happens if energization arrives later than the hardware. An electricity price without those conditions is an incomplete basis for comparison.
This does not make the lowest-cost power location universally preferable. Latency, network connectivity, customer requirements, staff availability, and the characteristics of the workload still matter. The implication is that location needs to be evaluated as a system of constraints, rather than a single price on a spreadsheet.
Cooling also changes the calculation. For an illustrative 100 MW IT load, a facility operating at a power usage effectiveness of 1.2 draws 120 MW in total; at 1.5 it draws 150 MW. At continuous full load, the 30 MW difference is 262,800 MWh per year. This arithmetic isolates the facility overhead. It does not predict either site's actual utilisation, cooling performance or electricity bill.
Cheaper intelligence can support more demand
Stanford's 2025 AI Index reports a greater than 280-fold decline in the inference cost of achieving GPT-3.5-level performance between November 2022 and October 2024. 2 This measures a particular capability threshold over a historical period. It is not a promise that every production workload will become cheaper at the same rate.
The distinction matters because a lower unit cost can have two different effects. It can reduce the expense of an existing task. It can also make new tasks worth attempting. A workflow that once generated one answer might begin comparing alternatives, checking its own work, or processing material that was previously uneconomic to inspect.
Consider a hypothetical support operation. If the cost of classifying a message halves and the number of messages stays constant, its inference bill falls. If the team instead adds retrieval, drafting, verification, and follow-up processing, total model usage may increase. Neither outcome follows from the price change alone; product design and adoption determine the result.
Infrastructure planning therefore needs separate assumptions for cost per operation, operations per workflow, and the number of workflows. Combining them into a single forecast hides the mechanism that management most needs to understand.
The useful question is not how many tokens a company can afford. It is which work becomes viable at a new cost and quality threshold. That question connects technical efficiency to demand without assuming that every possible use will become a paying market.
Installed capacity is not productive capacity
A chip specification describes one part of a larger system. The useful output of a service also depends on its memory behavior, request mix, scheduling, networking, and reliability requirements. Comparing machines without specifying the workload leaves much of the economic question unanswered.
The original vLLM work provides a concrete example. Its PagedAttention approach addressed wasted memory in the key-value cache used during language-model generation, allowing more requests to be batched. 3 The broader lesson is that software organization can change how much work a fixed hardware installation delivers. Its original benchmark results should not be treated as universal gains for today's systems.
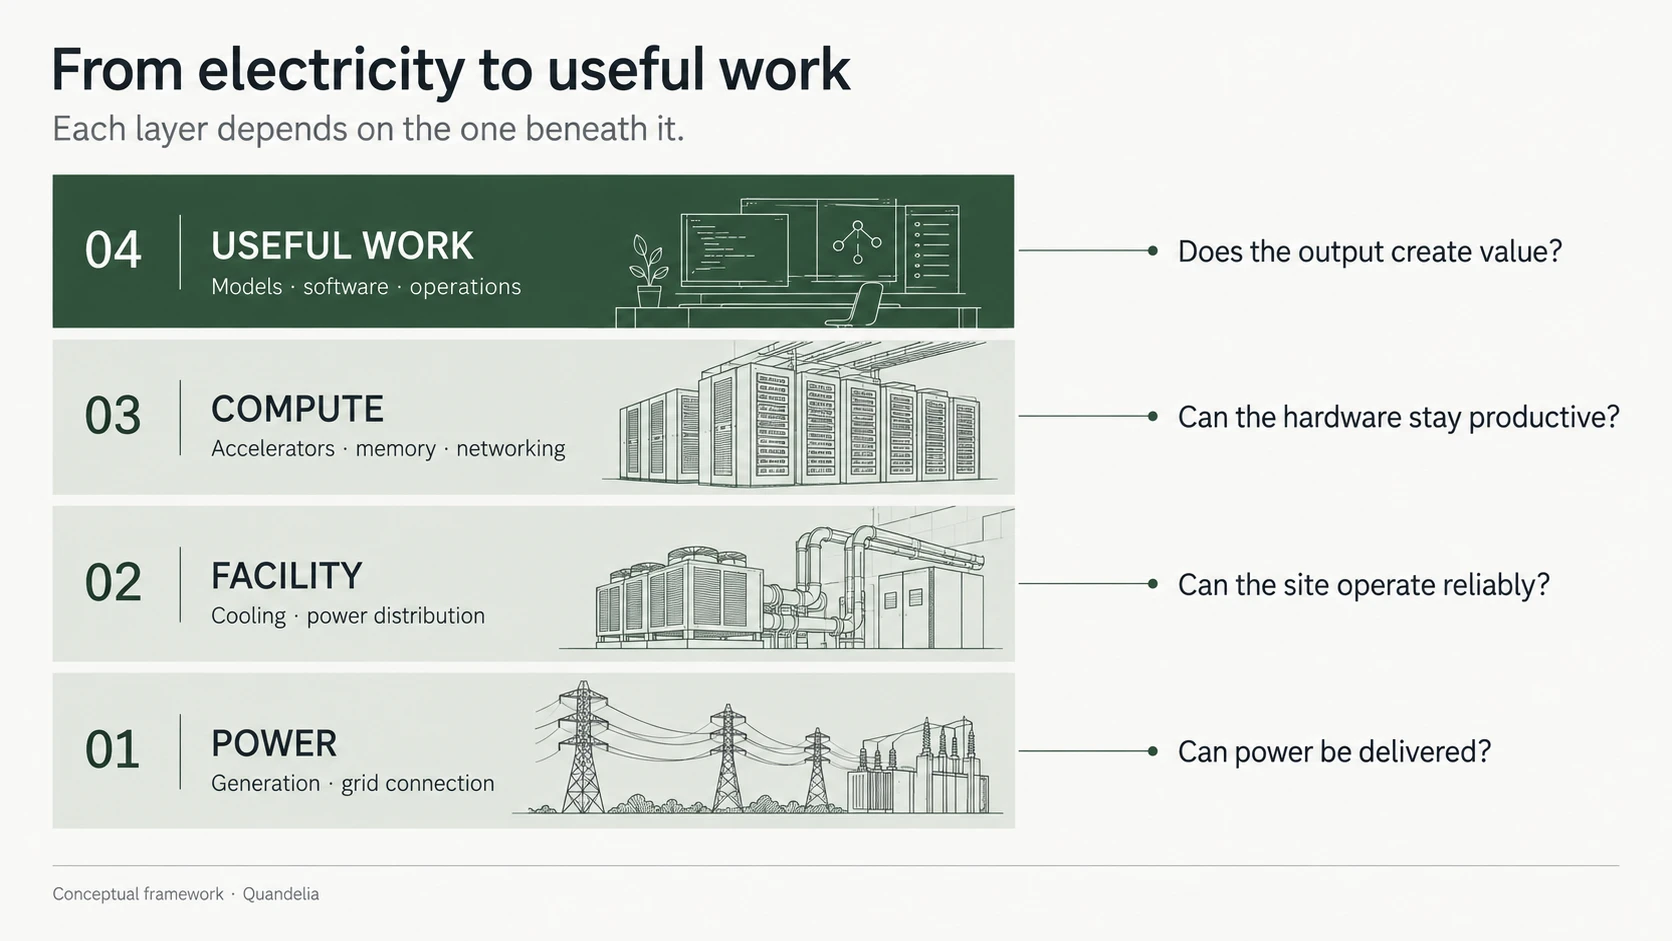
For an operator, utilization also needs a careful definition. A machine can be busy producing answers that are late, unnecessarily long, or unsuitable for the task. Conversely, keeping spare capacity may be necessary to serve bursts or preserve availability. Maximizing a hardware utilization percentage is not automatically the right objective.
We would evaluate a service using cost per successful task, at a defined quality and latency target. This makes the trade-offs visible. A smaller model may reduce compute needs but increase human review. A larger batch may improve throughput while slowing individual responses. An additional verification step may consume more tokens while reducing expensive errors.
The practical discipline is to benchmark a representative workload before making a large commitment, then repeat the measurement when the model, traffic pattern, or serving configuration changes. Infrastructure economics belong in the operating loop, not only in the original procurement document.
Control is a question of dependencies
The language of sovereign compute often compresses several different objectives into one phrase. Local hosting, operational control, continuity of access, and the ability to change suppliers are related, but none guarantees the others.
A locally operated facility may still rely on imported hardware, an external software stack, remote support, and a limited number of replacement-part suppliers. A remotely hosted service may offer strong portability for some workloads while leaving others tightly dependent on proprietary interfaces. Geography is one dimension of the dependency map.
For Quandelia, the useful starting point is an operational question: what must remain possible if a critical provider becomes unavailable? The answer differs for a research cluster, a customer-facing application, and a sensitive internal workflow.
A team can then identify the specific dependencies that threaten that requirement. Can it export the data in a usable form? Can another environment run the workload? Who holds the operational knowledge? How long would a replacement take to bring into service? These questions produce a more actionable view of control than an infrastructure label alone.
This is also where portability should meet proportionality. Maintaining several interchangeable environments has a cost. For an ordinary, replaceable workload, that cost may exceed the benefit. For a critical operation, an untested recovery path can be a much larger exposure. The right level of independence follows from the consequence of interruption.
Match commitments to what is known
The decision framework below separates organizations by the choices they can actually make. It is a way to structure evaluation, rather than a recommendation that every organization should own infrastructure.
| Decision maker | Question to resolve first | Evidence to request |
|---|---|---|
| Product team | Which tasks need this level of capability? | Task-level quality, latency, and total operating cost |
| Infrastructure operator | What prevents this site from delivering useful capacity? | Connection milestones, commissioning dependencies, and workload benchmarks |
| Enterprise buyer | How costly would changing provider be? | A tested export and migration path, with realistic recovery times |
| Public-sector sponsor | Which capability must remain available locally? | A dependency map tied to an explicit continuity requirement |
For product teams, the first commitment should often be to measurement. An uncertain workload does not become predictable because a supplier offers a long contract. A small deployment can establish demand, failure modes, and operating cost before the organization decides which risks it is prepared to carry.
For infrastructure operators, the central task is coordinating interdependent delivery dates. A completed building, an allocated hardware order, and a signed power agreement are different milestones. A plan becomes credible when it shows how they converge into an operating service, including the consequences if one slips.
For buyers and public-sector sponsors, the question is what control is worth in a specific setting. Requirements should identify the capability to preserve and the interruption to withstand. That gives procurement a testable objective and makes it easier to compare different ways of meeting it.
What would change the thesis?
The case for physical infrastructure as a constraint does not imply that every announced project will be needed, or that more compute will always earn an attractive return. Supply can be difficult to build and still exceed demand in a particular place or market segment.
Three developments would change the balance. First, stronger efficiency gains could reduce the capacity needed for economically valuable tasks. Second, adoption could disappoint if reliable automation proves harder to integrate than expected. Third, faster delivery of power and facilities could move the bottleneck toward customers, software, or operational execution.
There are also paths in the other direction. Workflows could become more computationally intensive, or new capabilities could create demand that existing services do not capture. These are possibilities to test, not reasons to treat an aggressive demand forecast as inevitable.
The indicators worth watching are consequently practical: completed connections rather than announced megawatts; sustained workload demand rather than trial usage; cost per successful task rather than headline token pricing; and demonstrated migrations rather than claims of portability.
The next compute cycle will be shaped by the relationship between physical capacity and useful output. Organizations that understand both sides can make more deliberate commitments—and recognize when the assumptions behind them have changed.
Methodology & scope
This is a qualitative synthesis, published in September 2026 and updated on September 13. The electricity figure preserves the IEA's 2025 estimate and base-case projection; the adjacent text separately identifies its 2026 update. Neither is a Quandelia forecast. The Stanford cost comparison and vLLM serving example describe their respective historical periods. The cooling calculation assumes a constant 100 MW IT load over 8,760 hours and is illustrative.
The support-workflow example is hypothetical. The infrastructure layers, evaluation questions, and implications are Quandelia's interpretation. Cover imagery, the chart, and the diagram are AI-generated; the chart's numerical values are stated in the text, and the diagram represents a conceptual relationship. No facility illustrated here is presented as a documented site.
The evidence behind the analysis